
AI Strategy
/
feb 16, 2025
Strategy for Measuring & Improving AI Products
The moment you plug your product into an LLM, you stop shipping predictable software and start calibrating a probabilistic system. Model upgrades can look like progress while outcomes stay flat, costs rise, and trust erodes in ways SaaS-era metrics can’t see. Your AI product strategy should look like an F1 team: horsepower is table stakes, winning comes from setup, telemetry, and constant calibration under changing conditions.
/
AUTHOR

Brittany Hobbs

LLMs are changing how products are designed, built, and monetized. They make it easier to ship new features, new interfaces, and new tiers. They also make it harder to know whether customers are getting better outcomes, or just getting more novelty.
This strategy gives product leaders a practical advantage: benchmark each release, separate real outcome gains from output glow, catch regressions early, and tune the system toward sustainable value. Done well, it creates compounding returns: fewer blind upgrades, faster learning, clearer competitive positioning, and a tighter trust loop with customers.
1) AI is rewriting how products are designed, built, and monetized
LLMs turn capability into distribution. They convert questions into workflows, and workflows into monetisation.
Vibe coding and AI-powered agents have compressed the time from insight to shipped feature from weeks to hours—and the cycle accelerates every few months. But this creates a dangerous asymmetry: teams are now iterating faster than they can collect insights. The build cycle has accelerated; the learn cycle has not. When you can ship three prompt changes in a week but only run a meaningful evaluation once a month, you are flying on intuition. A field study on generative AI in customer support showed productivity gains on average, but with meaningful differences across workers. Impact is not automatic. The teams shipping fastest are not necessarily the teams learning fastest.
2) Products look simpler to ship, but they are more complex to run
Traditional digital products were bounded—a button did one thing every time.
LLM products are probabilistic systems where the feature is not the UI but the behaviour of a chain of calls over time. Most AI products do not call a single model. They orchestrate retrieval steps, model calls, safety checks, tool calls, and feedback loops—each adding latency, cost, and a new point of failure. When those steps are themselves LLM-powered, the system is non-deterministic at every layer. A small change cascades unpredictably.
Meanwhile, product designers and PMs are learning prompt engineering, retrieval tuning, and orchestration architecture while simultaneously building and launching—flying the plane while building it. Research on hidden technical debt in machine learning systems explains why these systems become harder to maintain as they scale. The foundation shifts with every model update.
3) Model improvements can look like progress while outcomes stay unclear
New models often sound better. They handle more. They comply more often. That does not guarantee customers are more successful. It can also mean higher cost and new failure modes.
This is why measurement is treated as a first-class requirement in AI risk management. NIST’s AI Risk Management Framework centers measurement as a core function of managing AI risk and performance.
Even if you change nothing, the system can still change underneath you. Service LLMs evolve without public changelogs, which makes one-time evaluation brittle and makes continuous benchmarking a prerequisite for reliable improvement.
LLM outputs are also not stable under repeated inference. Recent work shows reliability and safety failure rates can diverge under repeated sampling and temperature changes, even when benchmark-style scores look similar.
4) Traditional products had predictable flows; LLM products create near-infinite paths
In classic products, breakdowns were observable because paths were finite. In LLM chat, users take countless routes: partial context, shifting constraints, mid-task pivots, contradictory instructions. The system must succeed across a broad distribution, not a narrow funnel.
When you widen the distribution of user paths, adoption can rise while inconsistency complaints persist because the telemetry is not capturing the variance. (See Point 6 for why this is structurally hard to observe.)
Multi-turn performance is measurably worse than single-turn in large-scale simulations, and the degradation is driven largely by increased unreliability. When models take a wrong turn early, they often do not recover.
5) Evals are necessary, but they do not certify real-world success
AI evals—automated tests that check outputs against defined criteria—are essential for catching regressions. But they are not proof that real users will succeed. The most common approach, LLM-as-judge (using a separate AI to score your system’s outputs), is fast and scalable. It is also unreliable in ways most product teams do not account for.
Position bias. When an LLM judge compares two outputs, it tends to favour whichever appears first (or last, depending on the model). The same output can win or lose simply by changing where it sits in the prompt. A study across 15 LLM judges and 150,000+ evaluations found that swapping response order can shift accuracy by over 10%, and the bias is worst when the quality gap is small—exactly when you need a reliable signal most.
Run-to-run inconsistency. LLM judges are stochastic—they can score the same response differently each time they run. Self-consistency research found intra-rater reliability as low as 0.26 (where 1.0 is perfect agreement), meaning worst-case ratings were barely better than random. Further reliability studies confirm that single-shot evaluations are insufficient—multiple runs with statistical aggregation are required for trustworthy results.
Other biases. Researchers have catalogued at least 12 distinct bias types in LLM-as-judge systems, including verbosity bias (favouring longer answers regardless of quality), self-enhancement bias (favouring outputs from the same model family), and authority bias (favouring confident-sounding answers).
Evals are a useful leading indicator, not a certificate of quality. They catch obvious regressions and compare versions at scale. But they are not a substitute for understanding what real users experience—that requires the additional measurement layers described in Sections 12 and 13.
6) Teams are flying blind on what changed, what improved, and what got worse
Most teams can measure adoption, monetization, and a few support signals. They cannot reliably answer, release over release: Did outcomes improve? Where does the system fail today? Did the upgrade increase cost without increasing success? How do we compare to competitors?
A randomized trial found experienced developers were slower with AI tools while believing they were faster. Perception diverged from outcomes. That is the risk when you only track usage and sentiment.
A common pattern: a model upgrade raises completion rates and lowers complaints, yet verification behavior spikes and repeat delegation drops. The product looks healthier, but customers are working harder to trust it, and long-term value erodes quietly.
7) Reliability is a product constraint, not an edge case
Fluency is not correctness. Completed is not success. Confident wrongness and omission are business risks in document processing, tax, compliance, support, and decision workflows.A comprehensive ACM survey frames hallucination as a central reliability challenge for LLMs and reviews mitigation approaches because it directly impacts trustworthiness.
This shows up in the wild. A 2025 analysis of AI mobile app reviews found measurable user-reported hallucination and cataloged common types like factual incorrectness and fabricated information.
8) Cost can climb faster than value if you only optimize for capability
Teams chase power—bigger models, longer contexts, more retries—and spend rises while outcomes stay flat. LLM pricing is consumption-based, with output tokens costing two to five times more than input. Most teams track cost-per-request rather than cost-per-successful-outcome, which hides the real expense of models that fail often. Agent swarms multiply this: multi-agent systems consume four to fifteen times more tokens than a single agent, and every coordination message burns tokens invisibly. Three agents finishing in two hours what one finishes in four burns 1.5x the tokens for 2x speed. The fix: measure cost alongside outcomes.
9) Security and data exposure risks become universal once you connect to LLMs
When your product ingests free-text, the boundary between data and commands disappears. Prompt injection is OWASP’s number-one LLM risk. OpenClaw’s security crisis made this tangible: an open-source AI assistant that crossed 180,000 GitHub stars in a week. Within three weeks, researchers found over 30,000 exposed instances leaking API keys and credentials, a one-click remote code execution vulnerability (CVE-2026-25253), and hundreds of malicious skills in its marketplace distributing credential-stealing malware. Cisco called it “an absolute nightmare”. The lesson: the more tools and data your agent accesses, the larger the blast radius. None of these vulnerabilities required sophisticated attackers—default settings and a Shodan search were enough. Security failures are product failures—users do not file incident reports, they leave.
10) The strategy: a balanced scorecard for AI products
If you have shipped SaaS, you already know you cannot steer on one metric. The Balanced Scorecard taught organisations to measure the customer perspective, internal processes, and learning alongside financials. Google’s HEART framework adapted that for digital products. Both assume deterministic systems—the same input always produces the same output. AI products break that assumption. Quality drifts without code changes. “Task completion” no longer means the user got what they needed. You need a framework built for this reality.
The Bullseye Framework organises measurement around four pillars. Think of it as a Venn diagram, not a target—every organisation weights these differently based on their product type, risk profile, and maturity. A compliance tool over-indexes on Power. A consumer creative tool over-indexes on Joy. The bullseye is not the centre of all four—that would be impossible. It is where your specific priorities overlap.
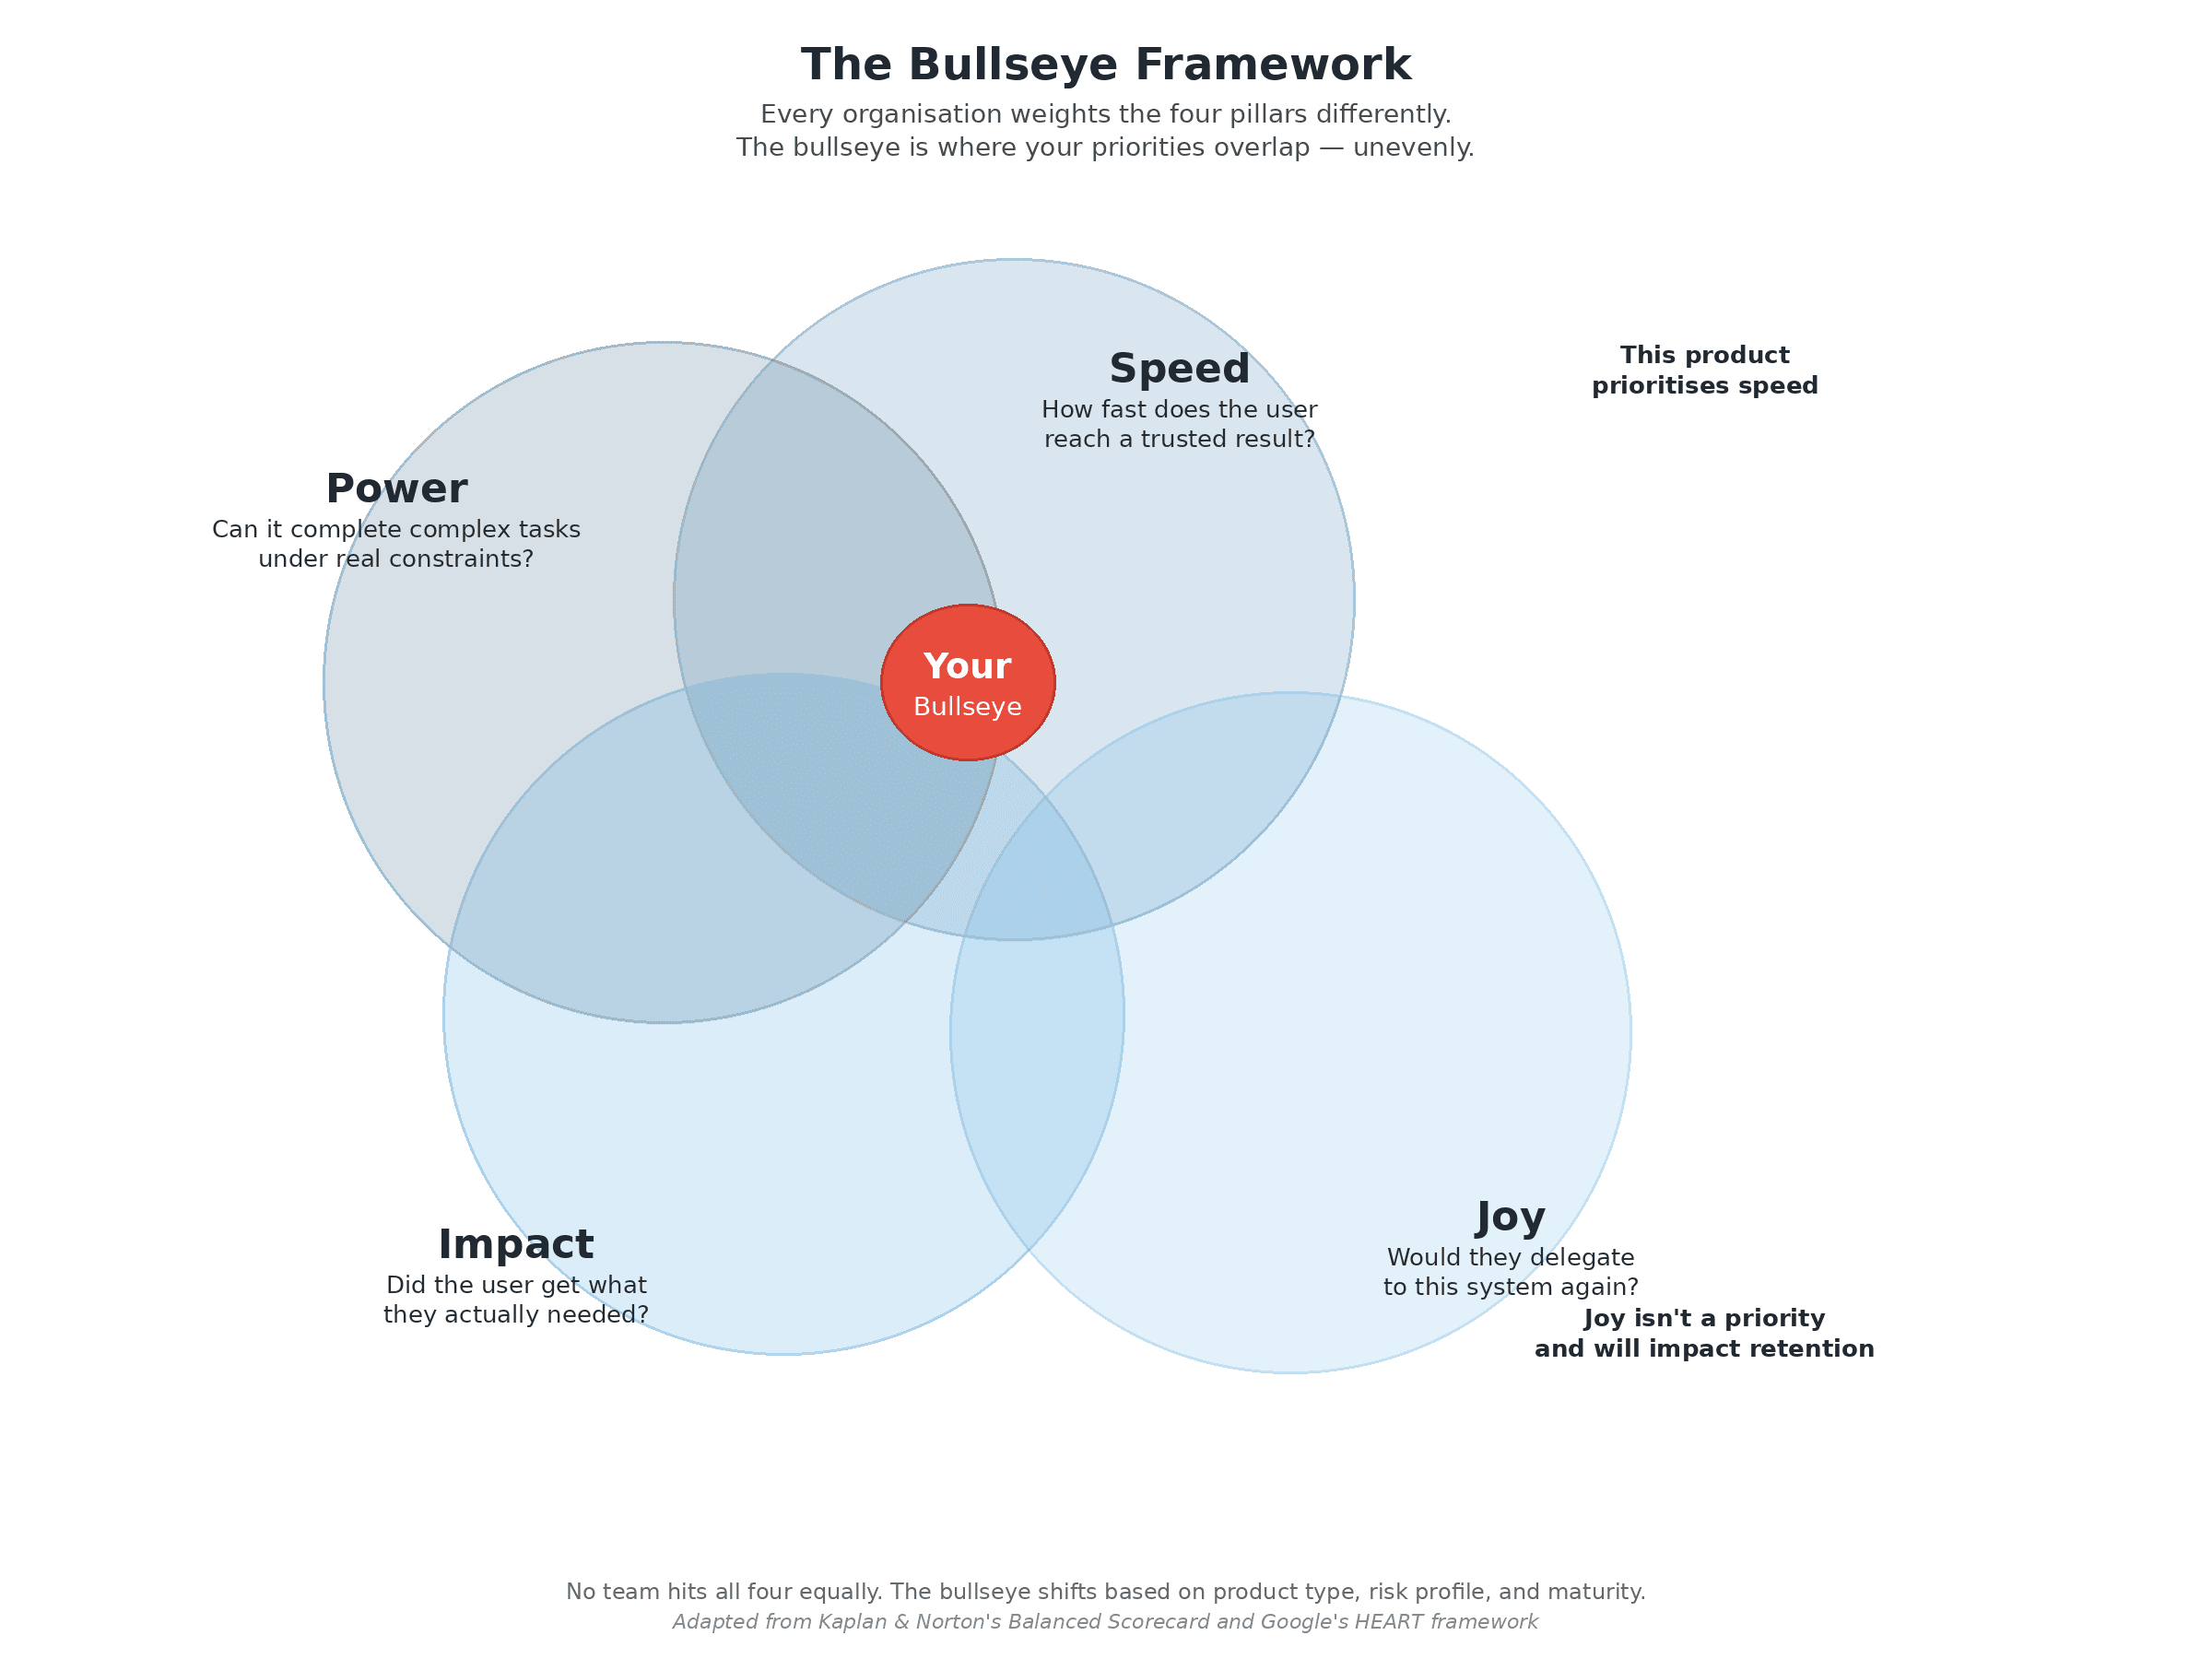
Power — “Can it complete complex tasks under real constraints?” Like uptime for SaaS, but for capability. Not benchmark scores—can the system handle multi-step, ambiguous, real-world requests with messy inputs, actual retrieval pipelines, and production latency budgets? A system that aces a demo but struggles with edge cases in production has a Power gap. Measure task success rate across complexity tiers, error classification by type, and the share of requests handled without human escalation. Track with tools like Braintrust or LangSmith.
Speed — “How fast does the user reach a trusted result?” Like time-to-first-value in onboarding, but ongoing. Not response latency—time-to-value (how fast they get something actionable) and time-to-confidence (how fast they stop verifying). A two-second response that takes five minutes of checking is slow.
Impact — “Did the user get what they actually needed?” Not the output—the reaction. Like measuring whether a customer achieved their goal after onboarding, not just whether they completed the steps. Did the user act on the result? Did they come back with another task? Did the improvement hold at 30, 60, 90 days, or was it a novelty spike?
Joy — “Would they delegate to this system again?” Like NPS, but specific to trust. Not “did you like it?” but “would you hand this system a high-stakes task?” When Joy erodes, users stop delegating even when the system technically works. Google’s People + AI Guidebook provides research-backed patterns for designing trust and user agency.
11) Every release needs a pre-flight checklist
In traditional SaaS, you ship a feature, measure adoption, and move on. In AI products, every change—a model swap, a prompt tweak, a retrieval pipeline update—can shift all four pillars at once. A prompt change that improves accuracy might slow responses. A model upgrade that sounds more fluent might hallucinate more. LLM outputs shift materially with small prompt changes and temperature settings. Treating these as minor deploys is how regressions go unnoticed.
Before any change ships, run it through a release checklist. Here is what that checklist looks like in practice:
Impact delta. Run a before-and-after comparison on a representative sample of real user queries. Did task success rate improve? If your baseline is 72% successful task completions, does the change move it—and does it hold after a week?
Trust delta. Ask a small group of users to try both versions. Do they feel more or less in control? Are they verifying the AI’s work more or less often? You can measure this with a simple post-task question: “How confident are you in this result?”
Cost delta. Track cost-per-successful-outcome, not cost-per-request. A cheaper model that fails more often costs you more in rework, support, and lost trust. If your current cost is $0.12 per successful outcome, does the new version improve or degrade that?
Risk delta. Did the change introduce new error types? Did hallucination rate shift? Are safety guardrails still holding? Log error classifications before and after.
Benchmark these against your own baselines—your current task success rate, your current cost-per-successful-outcome, your current user confidence scores. The goal is not perfection across all four. It is knowing exactly what you are trading off with every change you ship.
12) Know what your AI actually did: a recommended measurement framework
In SaaS, you already measure two tiers. Your lagging indicators—churn, renewal, NPS, revenue—tell you the result after the fact. Your leading indicators—activation rate, feature adoption, support ticket trends—predict where those numbers are heading. AI products need a third tier. The reason is straightforward: the same AI feature can produce different results for different users on different days, so you cannot assume that a feature “working” in your logs means it is actually helping. You need to know what happened during each user session, why, and how the user felt about it. Engineers call this observability. For product leaders, think of it as a flight recorder for your AI product.
We recommend organising your measurement in three layers. Each answers a harder question than the one before. Most teams only have the first layer. The insight that drives retention and trust lives in layers two and three.
Layer 1: System Health — “Is the system running?” This is the equivalent of uptime monitoring, error rates, and response times—signals your engineering team already tracks. Did the API respond? Did the model time out? Did it escalate to a human? This tells you whether the machine ran. It does not tell you whether the answer was useful. Example: a support bot resolves 85% of tickets without escalation. That looks great in a dashboard—until Layer 2 reveals 30% of those “resolved” tickets reopen within 48 hours. Tools: Datadog, Honeycomb, OpenTelemetry.
Layer 2: Outcomes — “Did the user get what they needed?” This is the equivalent of your conversion funnel, but it picks up after the AI responds. Did the user achieve their actual goal, or just receive a response? How long from first interaction to completed outcome? How quickly did they stop double-checking the AI’s work (time-to-confidence—a direct proxy for trust)? Did they edit or redo the output? Did they finish but not take the next logical step (post-completion drop-off)? And the strongest behavioural signal of trust: did they come back and hand the system another task?
Layer 3: Experience — “Would they use it again?” This is the equivalent of a post-purchase NPS survey, but for every meaningful AI interaction. It catches the failures that the other two layers miss entirely: the AI gave a correct answer, but the user could not tell it was correct, so they spent ten minutes verifying. The system completed the task, but the user felt out of control the whole time. These are silent failures—they never show up in your logs or your outcome metrics, but they are the reason users quietly stop relying on your product. Ask simple questions after key interactions: “How confident are you in this result?” “Did you feel in control of the process?” Google’s People + AI Guidebook has research-backed patterns for this. And the single most predictive question you can ask: “Would you use this again for this task?”
13) Validate before you ship: the eval ladder
If you have shipped SaaS, you already have QA tiers: unit tests catch code bugs, integration tests catch system bugs, staging catches workflow bugs, and post-launch analytics catch business impact. AI products need the same layered approach, but adapted for systems where the same input can produce different outputs. Most teams pick one evaluation method—automated tests or an A/B test—and treat it as enough. It is not. An automated test can confirm the output was valid formatting, but not that it confused the user. An A/B test can tell you which version got more clicks, but not why. The eval ladder, used by teams at OpenAI and Braintrust, stacks four methods so each rung catches what the one below it misses.
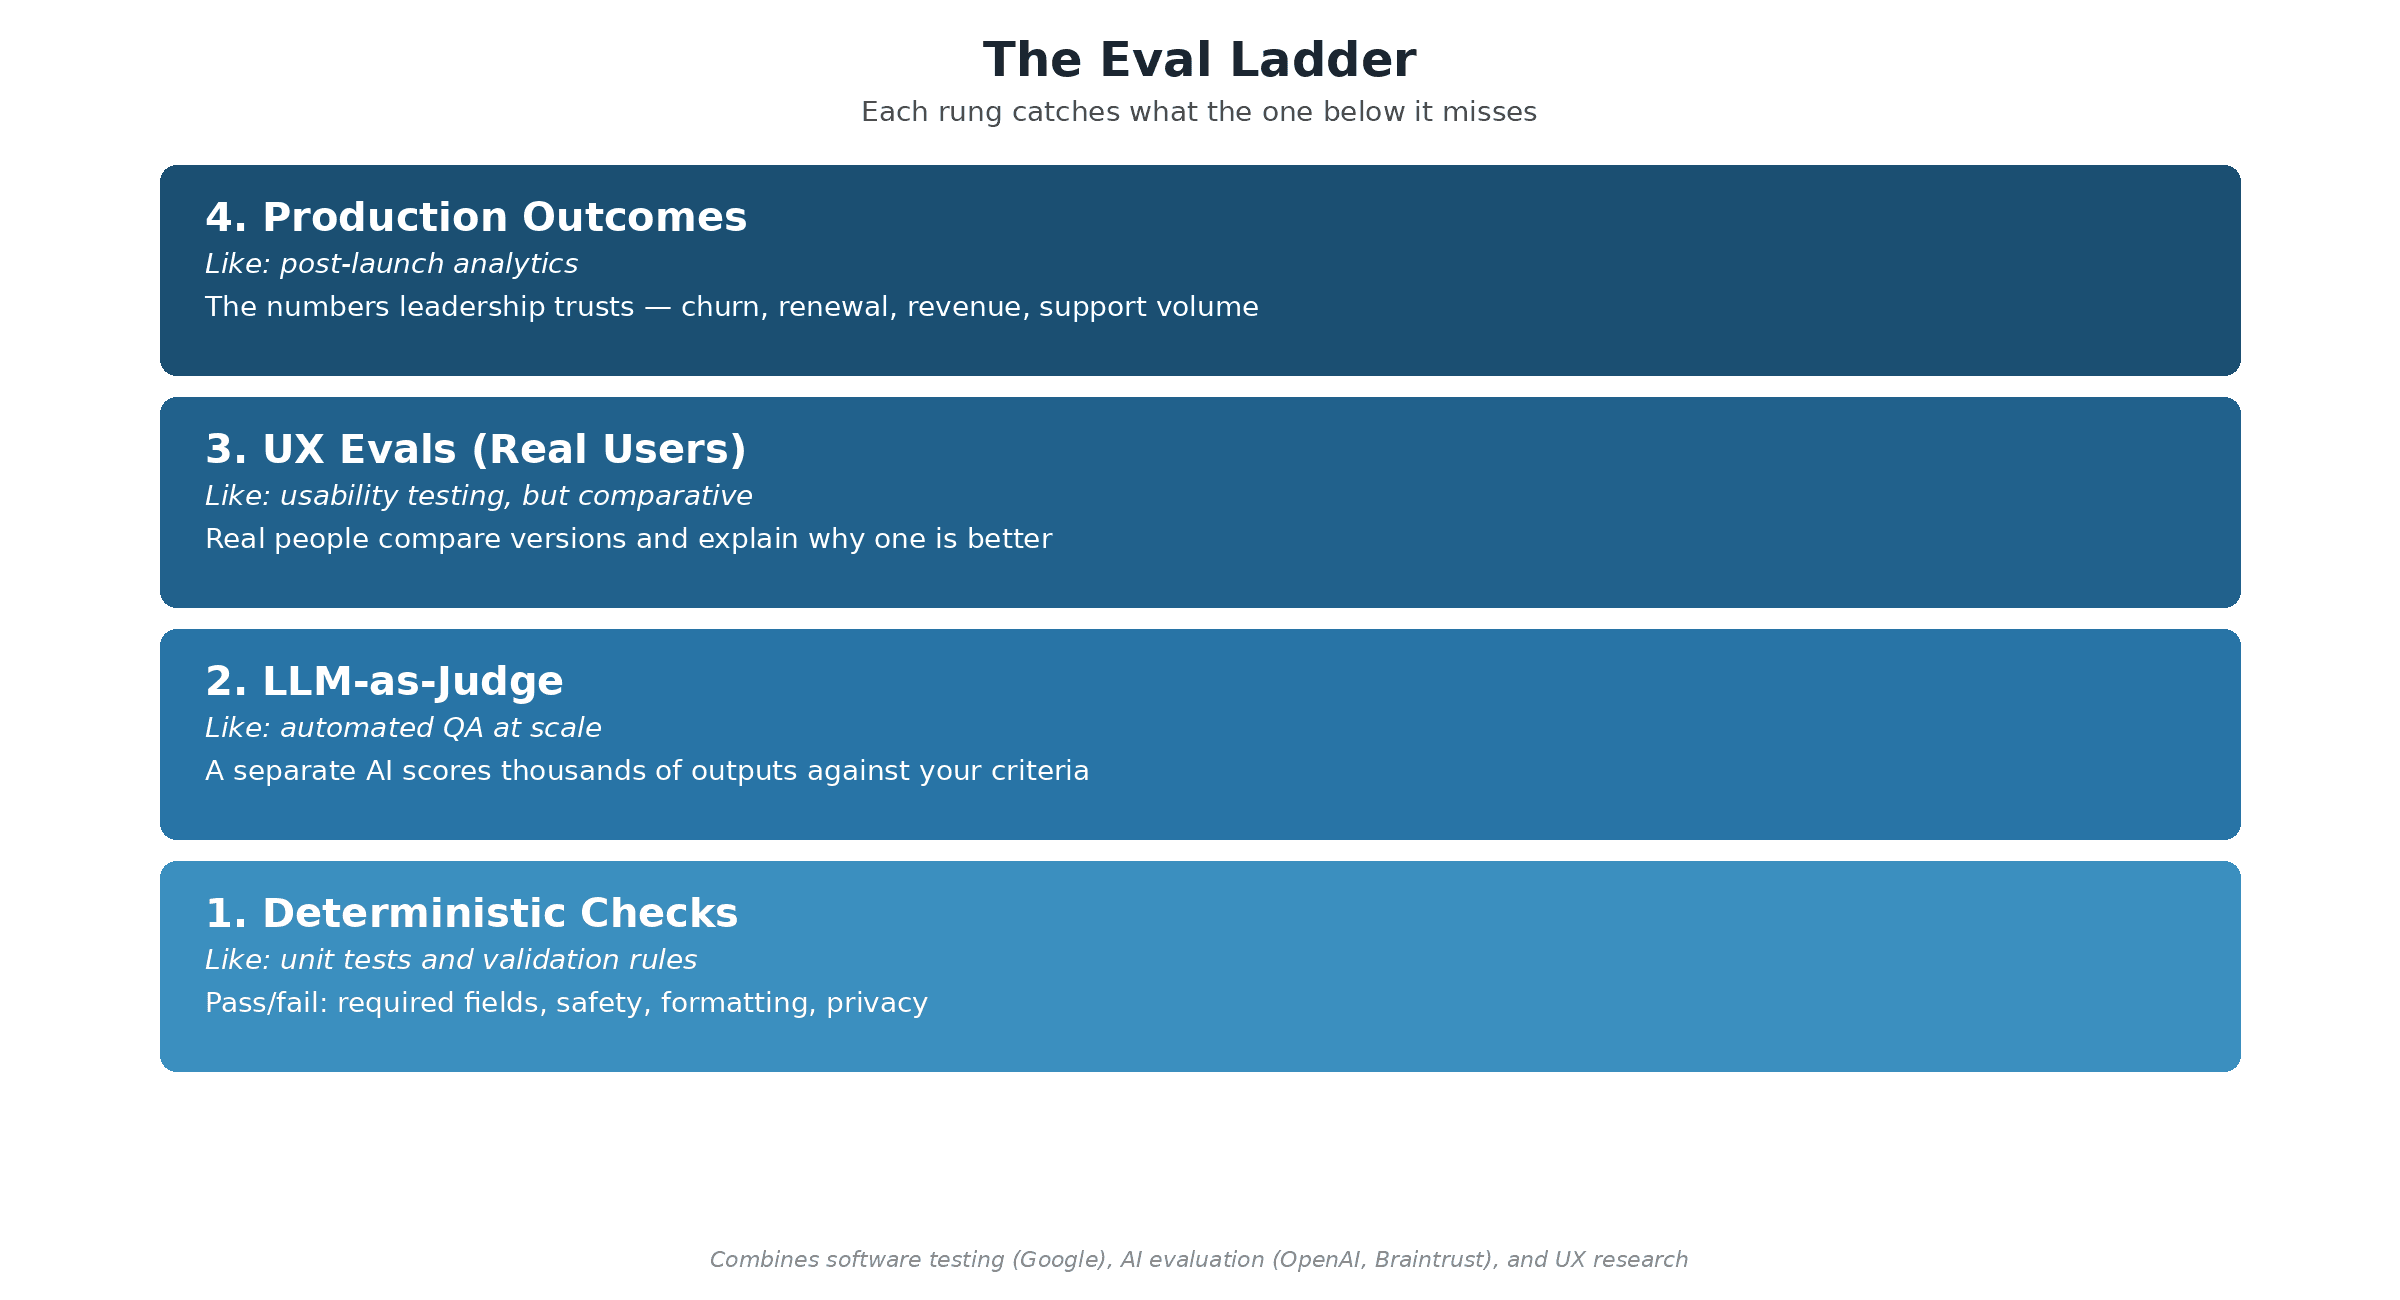
Rung 1: Deterministic checks. Like unit tests. Pass/fail assertions for non-negotiables: required fields present, safety guardrails respected, valid formatting, data privacy rules honoured. Cheap and fast. The Google Testing Blog covers assertion patterns; Guardrails AI provides validation tooling built for LLM outputs.
Rung 2: LLM-as-judge. Like automated QA at scale. A separate AI model scores your system’s outputs against criteria you define—accuracy, completeness, tone. This lets you evaluate thousands of outputs without a human for each one. The limitation: judge models have their own biases. Treat scores as directional, not definitive.
Rung 3: UX Evals with real participants. Like usability testing, but comparative. Real people use two or more versions of your AI experience and report on usefulness, trust, and clarity. Unlike traditional usability testing, these quantify which version wins and explain why. Outset UX Evals offers a platform for running these at scale.
Rung 4: Production outcome validation. Like post-launch analytics. Confirm results using the business metrics leadership trusts: churn, renewal, revenue, support volume. By combining this with the measurement framework from Section 12, you can attribute changes to specific releases and separate genuine improvements from novelty effects.
Use the ladder to tune the bullseye for your product. A compliance tool prioritises Power. A creative assistant weights Joy. A support agent needs Speed. The eval ladder shows you which pillar is drifting, and the bullseye gives you a shared language across engineering, product, and design to decide what to fix first.
Don't worry, this is what our team at PH1 Research can help you with.
What happens if product teams don’t change
Capability-only optimisation burns money. Bigger models, longer contexts, more retries—cost scales while value stays flat. OWASP identifies unbounded consumption as a top-10 LLM risk. The fix: cost-per-successful-outcome, not cost-per-request.
Autonomy creates invisible externalities. The ClaudeBot crawling controversy: an automated system operating within intended parameters generated reputational damage because behaviour was not constrained by observability.
Agent hype outpaces controls. Moltbot shipped a personal agent that could send texts and spend money—but also leaked data and acted in ways users did not intend.
Flying blind turns uncertainty into liability. Air Canada’s chatbot gave a customer incorrect information. The customer acted on it, and the airline was held legally responsible.
How PH1 can help you
PH1 exists to help product leaders build AI products that customers trust and businesses can sustain. The framework described here is how we work with clients. We help teams define what success means, instrument the signals that prove it, and build evaluation practices that catch regressions before customers do. This is also why we started the Product Impact Podcast.
Some services we can help you with:
AI Strategy & Product Planning — Define your bullseye pillars, identify the right metrics, and build a measurement roadmap.
UX Research for AI Products — Run UX Evals and satisfaction studies that reveal what automated metrics miss.
Improve Product Impact — Benchmark your experience, identify drift, prototype improvements, and validate through the eval ladder.
/
BLOG


